HOW MUCH C02 DO YOU CAUSE?
The first step along the road (every long journey starts with a small step, as Mao Tse Tung said) is to measure your footprint, by using a tool that calculates the amount of Carbon that you emit or consume. This is a complex area as you need to calculate for Carbon and Greenhouse Gases, the amount you consume or the amount you emit, whether you include what you cause in other countries due to buying clothes and mobile phones from China and so on. What is much more important is to recognise what in your life or organisation causes the problem and then take action to reduce it. We will point up the actions you can take in our section of this website headed “ACTION”.
WHAT IS A CARBON FOOTPRINT?
We all are responsible for causing harmful Greenhouse Gases going into the atmosphere. You can find out more about the process on our website at SCIENCE.
There are broadly two activities going on. We can directly emit greenhouse gases into the atmosphere, or we can consume something which directly or indirectly causes the emission of harmful greenhouse gases. If we are a power station burning goal, we emit harmful carbon dioxide into the atmosphere. If we drink a pint of milk, then we will be consuming an item which causes the emission of Greenhouse Gases through the farming process, the cows belching methane, and the transport and storage of the milk to our table.
From various assumptions about the activities, and knowledge of the production and distribution processes, scientists can calculate the amount of gas emitted or consumed. Mike Berners-Lee’s book “How bad are bananas?” is a good source of these calculations.
SCOPE 1,2,3 – WHAT IS THIS?
If we are going to take action on reducing the emissions of greenhouse gases, then we need to have clarity about who is responsible for the consumption and emissions of gas, and hence be clear about whether people and organisations can take direct action to reduce the impact on the atmosphere, or whether any action we can take must be carried out through influencing others. Thus, for instance, a Local Authority can directly impact only 2 % of the emissions in their area on average. They can do this by hanging the infrastructure (buildings) to emit less CO2 eq. However, they can influence as much as 33 % of total emissions through the actions that they can take through working with suppliers etc.
Hence scientists have developed the framework of “Scope 1,2,3” emissions, which seeks to describe the ability of our scope of influence in controlling our impact on the atmosphere. It is particularly important for companies and organisations, so that they can see how and where their emissions occur. A simple definition is as follows:
SCOPE 1
Scope 1 describes those activities for which we are directly responsible, and where we can take direct control, and if we change our use of that item, then we will directly affect the impact on the atmosphere. So, in a personal capacity, if we travel less by car or invest in an electric vehicle, we can directly impact emissions. If an organisation or company uses its vehicles less or reduces the amount of gas or oil it uses in its processes, then that is an example of direct control of the impact of greenhouse gases. Thus we all should be working on what we control, and seeking to reduce our emissions of harmful greenhouse gases. If we invest in Solar panels to generate electricity in our house or business, then we are taking direct action to reduce dependence on fossil fuels.
SCOPE 2
Scope 2 describes those activities for which we are not directly responsible, but for which we can directly take action, and as a result have an impact on the emission of greenhouse gases into the atmosphere.
Thus we buy energy for heating or lighting. We can decide to buy energy from an organisation which sources its materials in ways which do not impact the environment. Thus if you buy from a company which sources all of its electricity from renewable sources such as wind power, solar energy or wave power, then we rely on our provider to take direct action on our behalf.
Octopus Energy is a company that is focused on developing renewable energy. Thus they state “Octopus Energy Generation is one of Europe’s largest investors in renewable power, managing 300+ UK green energy producers (mostly solar and wind farms). Last year, this was enough to power over 1.2 million homes. We plan on making that 50 million homes worldwide by 2027”. However, some of the electricity that they buy on your behalf will still be from oil and gas-powered stations. So they use “carbon offsetting”, which is a process of investing in projects which offsets the greenhouse gases that they consume. Not all offsetting projects work, so be aware of this fact. You can see this detail if you click on the following button.
You can find sources of Green energy on our Energy page.
SCOPE 3
Scope 3 is more complicated, as it is designed to capture the whole supply chain associated with our activities, and which we can influence indirectly. Thus an organisation may buy from a supplier who buys raw materials from China and the Far East, which are made in a factory that uses electricity made from coal. Thus In this category go all the emissions associated, not with the company itself, but that the organisation is indirectly responsible for, up and down its value chain. For example, from buying products from its suppliers, and from its products when customers use them. Emissions-wise, Scope 3 is nearly always the big item for organisations to control.
On an individual personal level, for instance, then buying a pair of jeans will bring with it around 19kg of of CO2 eq. of emissions, if you add everything in, including the cotton, the water, and transport to get them to the shop.
But don’t forget that a pair of jeans over their lifetime may well create a further 12 kg CO2 eq. as you wash them and tumble dry them (Scope 1 and 2 emissions).
So it is complicated as to how we categorise the emissions. But it is important to understand who is responsible for what in the emission and consumption of harmful greenhouse gases, and recognise that we can both be directly responsible for and indirectly influence what happens to the planet. Ultimately consumers must determine how they choose to use products to control greenhouse gases – which is why education is so vitally important.
Importantly we should note that the UK government measures its targets and objectives specifically around Scope 1 and 2 targets – thus what happens to the production and consumption of fossil fuels, and greenhouse gases within the UK.
But we as individuals need fully to understand our responsibilities as consumers of goods and services which have an impact on the planet.
CARBON FOOTPRINT TOOLS
There are a number of software programmes both online and as apps to be used on mobile phones and tablets, which will enable you to work out your footprint. They are the same as getting on scales – there are lots of different types out there, just as there are with scales. Here is a selection of some of them
World Wildlife Fund.
WWF have produced a simple tool that gives you a pictorial image of your Carbon Footprint. It asks you questions about your lifestyle and then breaks down your carbon consumption into four areas – Home, Food Travel and Stuff. It also has useful tips on how you can start to reduce your Carbon Footprint. We recommend this tool as part of our Carbon Tracking process as it is easy to do, and the data can quickly be collected.
Pawprint.
Pawprint’s tool is designed to engage employees within an organisation and get them to measure their footprint. You can download an app to your mobile phone to enable you to track your carbon emissions. It breaks down emissions by Home, Travel, Diet, Other and gives good tips on how to reduce your footprint, and log actions.
CarbonFootprint.com
CarbonFootprint.com’s calculator is also excellent for providing a more detailed analysis of your carbon footprint as an individual or as a household. There is also a tool for businesses. It asks you relatively detailed questions about your House, Flights, Car, motorbikes, Bus and Rail Travel, and “Lifestyle” and gives you a good summary measure.
Carbon Savvy
Carbon Savvy’s site provides a 1 minute, 5 minute and 45 minute calculator. The 5-minute calculator is easy to fill in allowing you to click on multiple choices. It asks for how much you spend on clothes, gas and electricity, and then comes up with a good summary of your overall carbon footprint. It breaks down your footprint into Energy, Transport, Flights, Food, Goods and Services, and Infrastructure. It has a useful actions page.
Giki Zero
Giki Zero’s site provides a comprehensive site to measure and log your carbon emissions and translates it into an overall score in terms of how good you are in managing carbon emissions. It gives a good guide on things you can do and allows you to plan actions to reduce your footprint. Good graphics to help support your activity.
CarbonIndependent
Carbon Independent’s tool gives you a one-page sheet for filling in details by household (to share out the data on electricity) and then asks individual consumption questions on travel etc. Gives a summary as a simple comparison against UK/World averages which useful.
Cool Farm
Farmers might like the Cool Farm Tool. This tool allows you to analyse carbon emissions by product type (Crop or Livestock). You will need to set up an account.
Business
The World Wildlife Fund has produced a very useful document on how to measure, what to measure and when to measure for small, medium, and large businesses. Typically businesses will need to develop a solution around a tailored approach to their business, and use one fo the tools above.
Parish/Town councils
Exeter University developed the Impact tool through the Centre for Sustainable Energy. The tool aims to give small communities (parish and town councils) usable data on their carbon emissions that is easy to understand and share. This will help communities work out their main “impact areas” – where focused action can contribute to cutting local emissions. It is based n the Parish Level and then adds up to the county level.
It allows Parish/Town councils to see their results based on both emissions (what the householders are responsible for) and territorially (how much gets emitted in it parish council area for instance as a result of cars driving through its area. They summarise the differences as follows:
1. Consumption-based carbon footprint. This shows the emissions produced as a result of what people within your parish, ward or council area use in their daily lives. This includes the obvious things like gas, electricity and petrol, but also products like food and drink, clothes, shoes, consumer electronics and appliances, as well as financial services, even where these emissions take place outside of the local area.
2. Territorial-based carbon footprint. This shows the emissions produced within the territorial boundaries of your parish, ward or council area, and is based on what happens in that space. So this includes emissions from the presence of roads or other transport systems, or local agriculture and manufacturing, whether or not local people were travelling on that road or using those products and services.
This screenshot shows the details you can get for Shrewsbury and Shropshire Council.
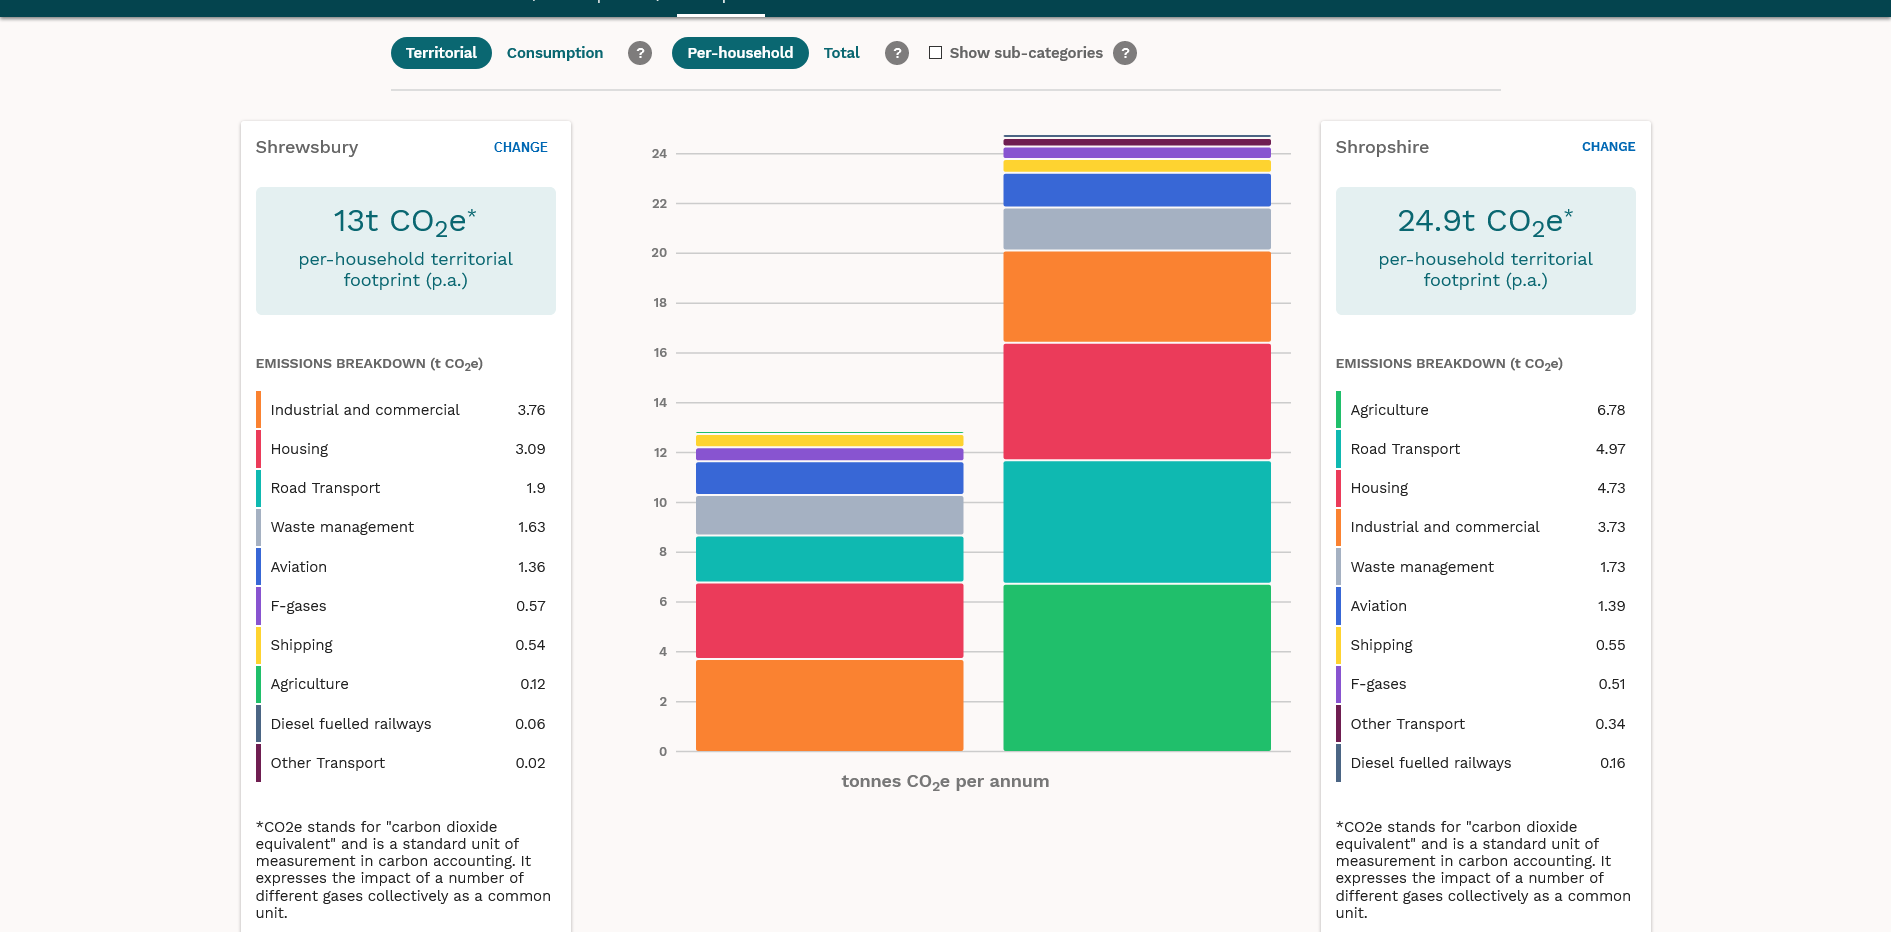
The council should use it then to work out local Parish/Town Council consumption and then drive local community action to tackle the main areas of carbon consumption or emission.